
AI‑Powered Climate Risk Analytics: Why Hyperlocal Data Matters for Accurate Risk Pricing
- Ankur Indrakush

- May 11
- 5 min read
In 2025, extreme weather hit 68% of Indian districts. Floods alone caused ₹15,000 crore in MSME losses. Businesses in Mumbai and Chennai shut for weeks.
Nearly 9.47 million hectares of crops were damaged in a single year. If you grow food or work outdoors, these numbers are personal. They are your harvest, your season. Crop failures in Maharashtra hurt farmers' suppliers.
These events disrupt cash flow quickly, and farmers and MSMEs lose income they cannot recover.
The Problem: One District Average Cannot Cover Every Location
India has 310 climate-vulnerable districts, out of which 109 are rated "very high" risk. In 2025, heatwaves affected 22 states. Monsoons brought 30% above-average rain in Kerala.
Additionally, the weather does not behave uniformly across a state. Two villages 20 km apart can see very different rainfall in one monsoon event. Two industrial hubs in the same state can experience significantly different weather events.
Standard insurance tools average data across entire districts, masking local variations. This averaging hides what actually happened on your farm or your factory.
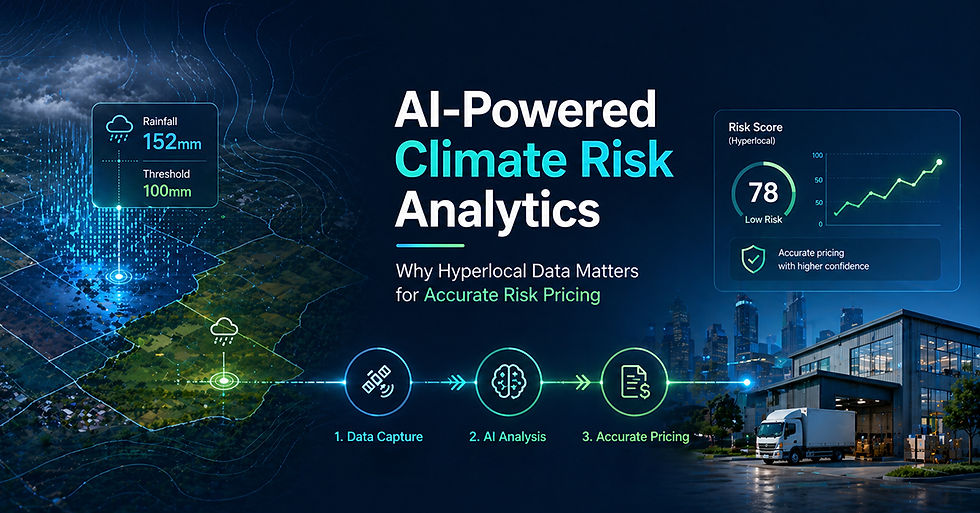
A climate risk analytics platform using hyperlocal climate risk data changes this. It maps risk at the pincode level. The trigger for your payout is based on your actual location.
What Parametric Insurance Means
Parametric insurance works differently from traditional insurance, paying out based on set triggers. You and the insurer agree on a measurable trigger before the season begins. Hyperlocal climate risk data from satellites or IMD weather stations confirms whether the trigger was met.
If the trigger is met, the payout goes directly to your bank account. No adjuster visit or inspection needed. You can think of it like a rain gauge. If rain hits 100 mm in 24 hours, payout starts. No need to inspect damage.
For farmers, this means a quick reimbursement without going into debt. For MSMEs, this means quick cash, which can reimburse them for their losses and carry on their operations.
How AI-Powered Climate Risk Modeling Improves Accuracy
Older parametric products used one or two weather variables. Total district rainfall is not precise enough when conditions vary sharply within one district. AI-powered climate risk modeling combines multiple data streams at once:
Satellite imagery updated daily
IMD gridded rainfall data at 0.25 degree x 0.25 degree resolution
Historical crop yield records from ICRISAT and the Ministry of Agriculture
Soil moisture readings from remote sensors
Seasonal monsoon pattern forecasts
The system learns from years of data, identifying location-specific triggers. As a result, the payout trigger is a specific measurable threshold, not a broad city-wide declaration.
Let’s take a look at a scenario: A farmer grows soybeans in Osmanabad, Maharashtra. His trigger is: rainfall below 180mm in his block between June 1 and July 31. A weather station 40 km away records 210mm, but IMD gridded data shows Ravi's block received only 155mm.
Using hyperlocal climate risk data, the platform determines that the trigger has been met. As a result, he receives his payout on time. Under a district-average system, this payment would not have been triggered.
What Changes in Practice with AI-Climate Risk Assessment
Hyperlocal climate risk data makes pricing fair. Factories pay based on real local risks instead of overpaying for distant events. Farmers receive payouts for actual events that can occur in their area.
Payouts become faster, certainty increases, and businesses and farmers can plan ahead.
Impact of AI-Powered Parametric Insurance on Businesses
The outcomes for businesses show the following:
Faster recovery: Reopen 70% quicker.
Lower loans: Avoid 18% interest debt.
Stable operations: Keep 20 more staff days yearly.
IRDAI notes parametric adoption rose 25% in 2025 for MSMEs.
Parametric vs. Traditional Crop Insurance at a Glance
PMFBY has paid Rs 1.83 lakh crore to 22.667 crore farmers since 2016. But delayed settlements remain a documented challenge. Parametric insurance does not replace PMFBY. It fills gaps where speed of payout matters most.
Here’s how AI-powered climate risk modeling in parametric insurance fares against traditional crop insurance:
Feature | PMFBY (Traditional) | Parametric Insurance |
Payout trigger | Survey-based yield assessment | Pre-agreed weather event data |
Time to payout | Weeks to months | 24-72 hours typical |
Inspection required | Yes — crop cutting experiments | No — data-driven, automatic |
Pricing basis | Regional actuarial averages | Hyperlocal historical climate data |
Table: Comparison between PMFBY and parametric insurance.
Where This Approach Still Falls Short
Hyperlocal climate risk data improves accuracy but does not eliminate basis risk (when actual losses do not match what the trigger measures). Even at high resolution, a block-level trigger can miss extreme conditions at the edges of that block. Dense rain gauge networks reduce this gap but do not close it completely.
If crops fail due to pests during a normal monsoon, a rainfall trigger pays nothing. If the temperatures in your area spike but still fall short of what is set for a heatwave trigger, no payment is made.
Swiss Re reports 15% basis risk in India pilots.
Wrapping Up: Using Hyperlocal Climate Risk Data to Power Parametric Insurance
Climate shocks hit Indian businesses hard. In fact, climate risk is harder to predict at a national scale and easier to measure at a local one. That is what makes hyperlocal data central to accurate insurance pricing on a climate risk analytics platform.
When AI climate risk assessment helps platforms with hyperlocal data fix pricing flaws. Further, they enable parametric tools for quick payouts.
Want to Experience Hyperlocal Parametric Insurance for Yourself?
If your livelihood depends on the weather, it is worth exploring what parametric insurance exists for your location and crop. Check out the parametric insurance products that use AI-powered analytics.
Frequently Asked Questions
What is a climate risk analytics platform?
A climate risk analytics platform is a technology system that gathers weather data, satellite images, and historical records to assess climate risk at a specific location. In insurance, it sets triggers and premiums based on village or pincode-level conditions. This makes pricing more relevant to real local weather than broad regional averages.
Who can currently access parametric insurance in India?
Farmers, dairy cooperative members, informal workers in delivery and construction, MSMEs, and businesses that are affected by weather are among the early beneficiaries. Eligibility depends on the specific product. Covers exist for kharif and rabi farmers, heatwave-exposed daily wage workers, and solar energy operators. Availability is growing as data and regulation develop.
How does AI-powered climate risk modeling work?
AI models pull data from sensors and satellites. They identify patterns, such as rainfall spikes in Mumbai or deficits in central Maharashtra. The system predicts risks and sets triggers, such as 120 mm of rain or less for droughts and 300 mm of rain or more for floods. Outputs guide fair pricing and fast payouts in parametric setups. No human verification is required.
What are the limitations of AI climate risk assessment?
Basis risk occurs when triggers miss actual losses, like low station readings despite floods. People can also miss out on payouts if they set the wrong triggers. Additionally, rural data gaps can hurt accuracy. It also does not account for non-weather risks such as fires. That is why a smart call is to pair with traditional checks for full cover.


Comments